Amazon Introduces Multi-Channel Fulfillment Analytics Dashboard for Tracking MCF Performance
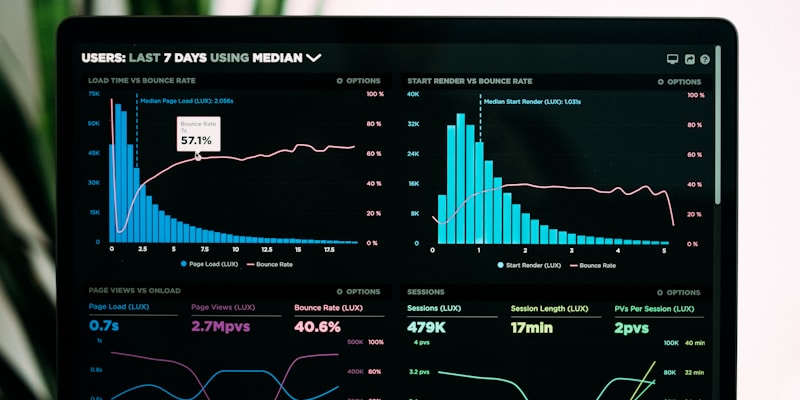
Amazon launched a Multi‑Channel Fulfillment Analytics dashboard in Seller Central this month, giving sellers a single pane to view up to 12 months of MCF order data. The tool offers custom date ranges, line/bar/pie charts, a Top‑SKU panel and one‑click CSV export.
Overview
Amazon has added a new Multi‑Channel Fulfillment (MCF) Analytics dashboard inside Seller Central, giving sellers a single pane of glass to track how their MCF orders perform on external marketplaces. The tool launched this month and lets sellers view metrics, spot trends, and adjust their fulfillment strategy without juggling multiple reports. Sellers who rely on MCF for Shopify, Walmart, or their own webstores should care because the dashboard turns raw data into actionable insight.
Key Points
- All‑in‑one view — The dashboard aggregates every MCF order from non‑Amazon channels into one screen, removing the need to stitch together separate CSV files.
- Year‑long history — Users can scroll back up to 12 months, making it possible to compare holiday spikes with off‑season performance.
- Custom date ranges — A flexible selector lets sellers isolate any window, such as a two‑week flash sale or the first quarter of the fiscal year.
- Chart‑driven snapshots — Line and bar graphs display order volume, on‑time delivery rate, and average fulfillment cost at a glance.
- Top‑SKU spotlight — A dedicated panel ranks the highest‑selling SKUs by MCF volume, highlighting products that drive the most external revenue.
- Export function — One‑click download of the displayed data enables deeper offline analysis or feeding into BI tools like Power BI or Tableau.
How the Dashboard Works
- Access via Seller Central — Log in, navigate to the “Performance” tab, and select “Multi‑Channel Fulfillment Analytics.” The home screen shows a real‑time summary of total orders fulfilled through MCF for the chosen period.
- Select a time frame — Use the date picker to choose a custom range; for example, a seller can set “01 Oct 2023 to 31 Oct 2023” to evaluate October’s performance across a new Shopify store launch.
- Review visual metrics — The interface presents a line chart of daily order count, a bar graph of average delivery speed, and a pie chart of fulfillment cost distribution, each updating instantly as the date range changes.
Analysis & Recommendations
Why This Matters
The dashboard consolidates all external‑channel MCF orders, eliminating manual CSV merges and reducing analysis time from hours to minutes. Sellers can instantly spot delivery delays or cost spikes, enabling faster carrier or inventory adjustments that improve profitability across Shopify, Walmart, Etsy and other marketplaces.
Key Takeaways
- Aggregates every MCF order from non‑Amazon channels into one screen, removing the need for separate reports.
- Provides a scrollable 12‑month history and custom date selector for periods like "01 Oct 2023 to 31 Oct 2023".
- Includes visual metrics (line, bar, pie charts) for order volume, on‑time delivery rate, and fulfillment cost.
- One‑click "Download CSV" lets sellers export the displayed data for BI tools or cross‑channel analysis.
Recommended Actions
- →In Seller Central go to Performance > Multi‑Channel Fulfillment Analytics and open the dashboard.
- →Set a weekly reminder to review the past week’s data, note any delivery‑time or cost changes, and export the CSV for deeper analysis.
Comments
Join the discussion
Log in or create an account to share your thoughts on this update.
No comments yet. Be the first to share your thoughts!